Multiple Choice
The following table describes the signs of the first and second derivatives of a function  :
:  0
0
1
2  +
+
+
+
+
+
0
-  -
-
0
+
-
-
-
-
Which of the following is a possible graph of 
A) 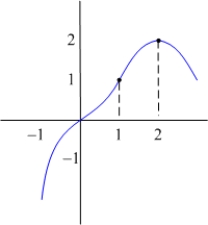
B) 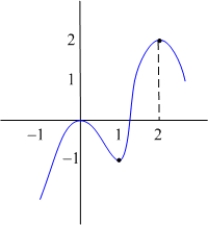
C) 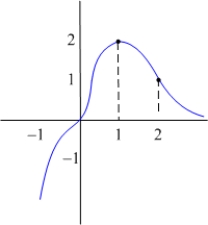
D) 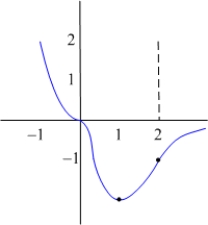
E) None of the above.
Correct Answer:

Verified
Correct Answer:
Verified
Q1: The following is the graph of <img
Q3: Find the maximum value <img src="https://d2lvgg3v3hfg70.cloudfront.net/TB5596/.jpg" alt="Find
Q4: Find the maximum value <img src="https://d2lvgg3v3hfg70.cloudfront.net/TB5596/.jpg" alt="Find
Q5: Determine the greater between <img src="https://d2lvgg3v3hfg70.cloudfront.net/TB5596/.jpg" alt="Determine
Q6: A factory produces 2000 products each month.
Q7: Given <img src="https://d2lvgg3v3hfg70.cloudfront.net/TB5596/.jpg" alt="Given such
Q8: The following table describes the signs of
Q9: Given the function <img src="https://d2lvgg3v3hfg70.cloudfront.net/TB5596/.jpg" alt="Given the
Q10: Find the dimensions and the perimeter of
Q11: A right circular cylinder is to be