Multiple Choice
Use the following to answer the question(s) below.
Weekly commodity prices for heating oil (in cents) were obtained and regressed against time. Below is the regression output and residual plots from fitting a linear model. 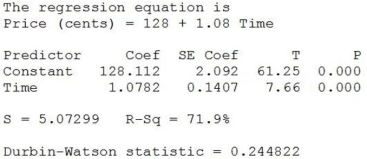
-Which of the following statement is true?
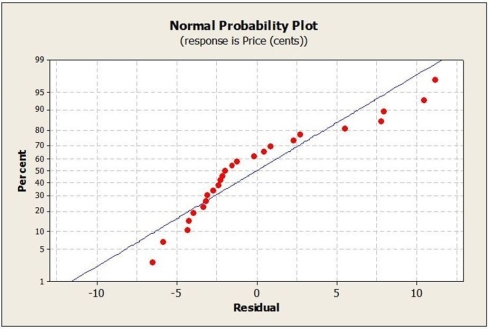
A) The normal probability plot shows no bend and indicates that Independence assumption is satisfied.
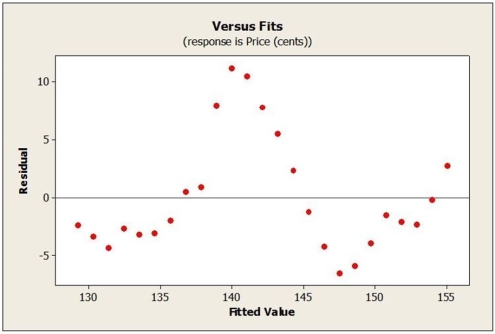
B) The residual plot has no pattern and indicates that Independence assumption is satisfied.
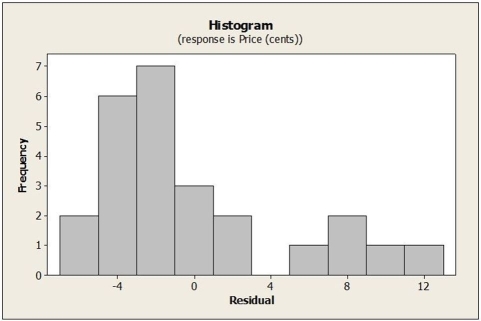
C) The histogram is relatively bell-shaped and indicates that Independence assumption is satisfied.
D) The t-test for the regression slope indicates that Independence assumption is satisfied.
E) The histogram and plots show that not all assumptions and conditions for regression inference are met. It looks like data are highly correlated over time. So, we should test the model for autocorrelation.
Correct Answer:

Verified
Correct Answer:
Verified
Q25: Use the following to answer the question(s)
Q26: Use the following to answer the question(s)
Q27: Use the following to answer the question(s)
Q28: The model <img src="https://d2lvgg3v3hfg70.cloudfront.net/TB6867/.jpg" alt="The model
Q29: The Durbin-Watson statistic indicates<br>A) that there is
Q31: Use the following to answer the questions
Q32: Which of the following is not true
Q33: A least squares estimated regression line has
Q34: The residual plot for a linear regression
Q35: Which statement about residuals plot is true?<br>A)