Multiple Choice
The following plot is the best for checking 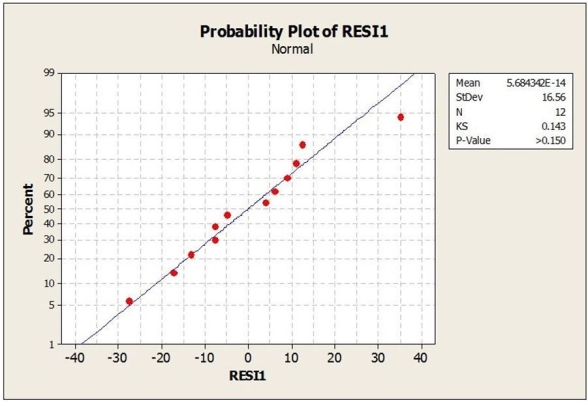
A) Equal Variance Assumption.
B) Linearity Assumption.
C) Nearly Normal Condition.
D) Non-linear Condition.
E) Dependence Condition.
Correct Answer:

Verified
Correct Answer:
Verified
Related Questions
Q16: Use the following to answer the question(s)
Q17: Use the following to answer the question(s)
Q18: Use the following to answer the question(s)
Q19: Use the following to answer the question(s)
Q20: Use the following to answer the question(s)
Q22: Use the following to answer the question(s)
Q23: Which of the following is not an
Q24: Use the following to answer the question(s)
Q25: A type I error is committed when<br>A)
Q26: Use the following to answer the question(s)