Multiple Choice
Consider the following to answer the question(s) below:
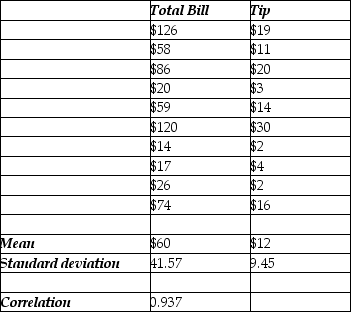
To determine whether the tip left at the end of a meal is related to the size of the total bill at their restaurant, Chez Michelle, data were gathered for 10 customers. The data and summary statistics are shown below.
-Analyze the scatterplot below. What solution strategy would be most appropriate? 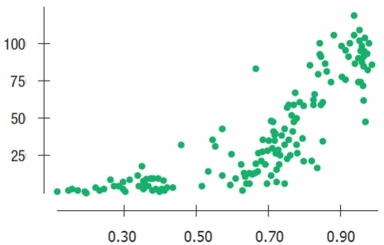
A) The relationship is perfectly linear. We should construct a linear regression model.
B) The relationship is straight enough. We should construct a linear regression model.
C) The scatterplot shows extreme outliers. We can swap the variables to transform it to linear model.
D) We should collect new data as we cannot identify the type of relationship.
E) This is an example of non-linear relationship. We can try to transform it to linear model by a function such as logarithm.
Correct Answer:

Verified
Correct Answer:
Verified
Q4: Consider the following to answer the question(s)
Q5: Consider the following to answer the question(s)
Q6: Consider the following to answer the question(s)
Q7: Consider the following to answer the question(s)
Q8: Consider the following to answer the question(s)
Q10: Consider the following to answer the question(s)
Q11: Consider the following to answer the question(s)
Q12: Consider the following to answer the question(s)
Q13: Consider the following to answer the question(s)
Q14: Consider the following to answer the question(s)