Multiple Choice
Consider the following to answer the question(s) below:
A consumer research group investigating the relationship between the price of meat (per kilogram) and the fat content (grams) gathered data that produced the following scatterplot. 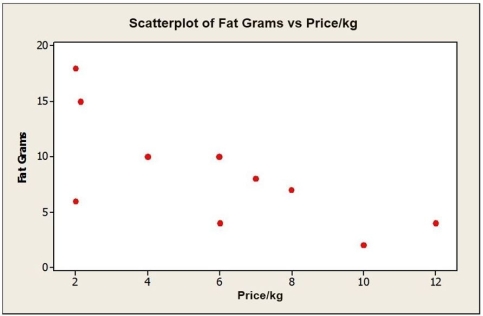
-Shown below is a correlation table showing correlation coefficients between stock price, earnings per share (EPS) , and the price/earnings (P/E) ratio for a sample of 19 publicly traded companies. Which of the following statements is false? Correlation: Stock Price, EPS, P/E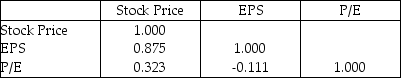
A) Since r = 0.323 for P/E and Stock Price, there is a relatively weak positive correlation between P/E and Stock Price.
B) The strongest correlation is between EPS and Stock Price.
C) There is a weak negative correlation between P/E and EPS.
D) The strongest correlation is between P/E and Stock Price.
E) The weakest correlation is between P/E and EPS.
Correct Answer:

Verified
Correct Answer:
Verified
Q7: Consider the following to answer the question(s)
Q8: Consider the following to answer the question(s)
Q9: Consider the following to answer the question(s)
Q10: Consider the following to answer the question(s)
Q11: Consider the following to answer the question(s)
Q13: Consider the following to answer the question(s)
Q14: Consider the following to answer the question(s)
Q15: Consider the following to answer the question(s)
Q16: Consider the following to answer the question(s)
Q17: Consider the following to answer the question(s)