Multiple Choice
Consider the following to answer the question(s) below:
The boxplots below show monthly sales revenue figures ($ thousands) for a discount office supply company with locations in three different regions of Canada (Atlantic, Central and West) . 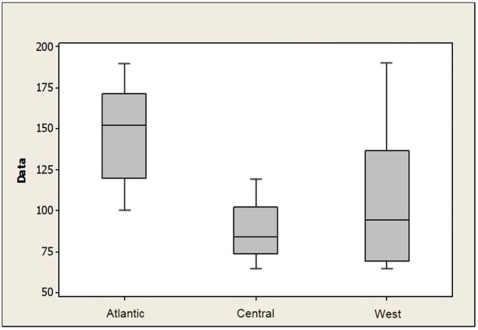
-Below is a time series plot for monthly closing stock prices of 3M Dental Products. Which of the following statements is true? 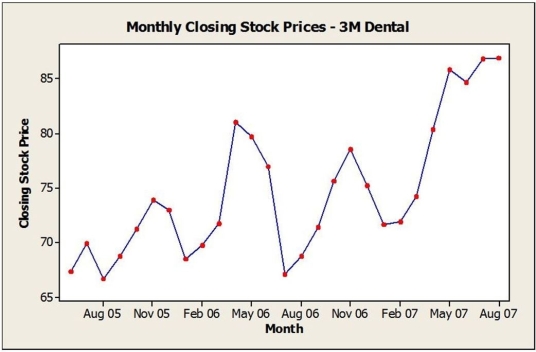
A) The data are stationary.
B) The data show an upward trend.
C) A histogram would provide the best representation of these data.
D) The data show a downward trend.
E) A boxplot would provide the best representation of this data.
Correct Answer:

Verified
Correct Answer:
Verified
Q4: Consider the following to answer the question(s)
Q5: Consider the following to answer the question(s)
Q6: Consider the following to answer the question(s)
Q7: Consider the following to answer the question(s)
Q8: Consider the following to answer the question(s)
Q10: Consider the following to answer the question(s)
Q11: Consider the following to answer the question(s)
Q12: Consider the following to answer the question(s)
Q13: Consider the following to answer the question(s)
Q14: Consider the following to answer the question(s)