Multiple Choice
A graph of a model for the sales of services between 2004 and 2008 by Kelly Services, Inc., a leading global provider of staffing services, is shown below. 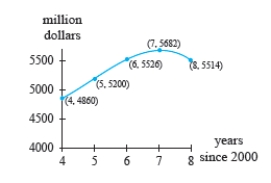 Calculate the percentage change in Kelly's sales between 2004 and 2007.
A) $822 million
B) $4860 million
C) $411 million
D) $10542 million
E) $5271 million
Correct Answer:

Verified
Correct Answer:
Verified
Q37: An object is dropped off a building.
Q38: The function g gives the fuel efficiency,
Q39: The function D gives the time, in
Q40: If <img src="https://d2lvgg3v3hfg70.cloudfront.net/TB6775/.jpg" alt="If find
Q41: Identify which points have lines drawn through
Q43: The figure shows the terminal speed, in
Q44: By imagining tangent lines at points <img
Q45: Clinton County, Michigan, is mostly flat farmland
Q46: A graph of a model for the
Q47: For a certain brand of bicycle, <img