Multiple Choice
The table below gives the normal daily mean temperatures, based on a 30-year period 1961 through 1990, for a certain city. Use the data to estimate the amplitude to the nearest degree. 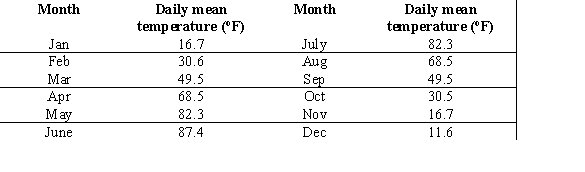
A) 
B) 
C) 
D) 
E) 
Correct Answer:

Verified
Correct Answer:
Verified
Related Questions
Q13: Choose the function type for the mathematical
Q14: Indicate whether the function is an increasing
Q15: What is the amplitude of the following
Q16: A chemical reaction begins when a certain
Q17: For the function, write the equations for
Q19: Calculate the total amount due after two
Q20: Find the amplitude of the following function.
Q21: For the given function write limit notation
Q22: The total cost for producing <img src="https://d2lvgg3v3hfg70.cloudfront.net/TB6775/.jpg"
Q23: The percentage of mothers in a large