Multiple Choice
The table below gives the normal daily mean temperatures, based on a 30-year period 1961 through 1990, for a certain city. Use the data to estimate the period. 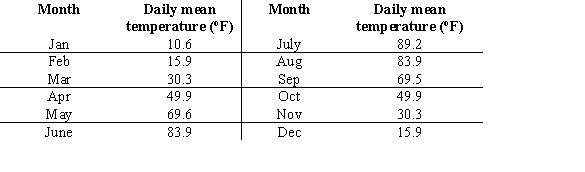
A) 11 months
B) 2 months
C) 4 months
D) 12 months
E) 360 months
Correct Answer:

Verified
Correct Answer:
Verified
Q40: Use the formula <img src="https://d2lvgg3v3hfg70.cloudfront.net/TB6775/.jpg" alt="Use the
Q41: Use properties of limits and algebraic methods
Q42: Find the period of the following function.
Q43: Find the amplitude of the following function.
Q44: In 1996, the population of a country
Q45: Write a linear model for the given
Q46: Find the equation of the quadratic function
Q47: Write the product of the two functions.
Q49: Numerically estimate the limits. Show the numerical
Q50: Some populations of animals exhibit periodic behavior