Multiple Choice
The table below gives the normal daily mean temperatures, based on a 30-year period 1961 through 1990, for a certain city. Which of the following sine models best represents the mean daily temperature, where x denotes the number of the month in a calendar year. 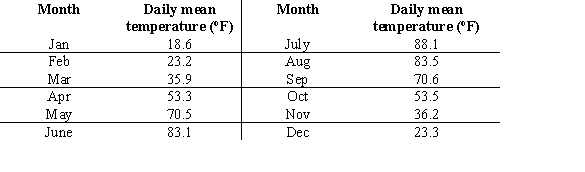
A) 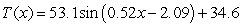
B) 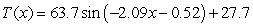
C) 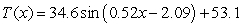
D) 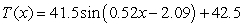
E) 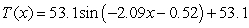
Correct Answer:

Verified
Correct Answer:
Verified
Q3: Given <img src="https://d2lvgg3v3hfg70.cloudfront.net/TB6775/.jpg" alt="Given evaluate
Q4: Calculate the constant percentage change for the
Q5: Use properties of limits and algebraic methods
Q6: Calculate the output value that corresponds to
Q7: What is the horizontal shift of the
Q9: Rewrite the following pair of functions as
Q10: Your credit card statement indicates a finance
Q11: Some populations of animals exhibit periodic behavior
Q12: Evaluate the function at the given values
Q13: Choose the function type for the mathematical