menu-iconExamlexExamLexServices

Discover

Ask a Question
  1. All Topics
  2. Topic
    Mathematics
  3. Study Set
    Calculus Study Set 2
  4. Exam
    Exam 14: Functions of Several Variables and Partial Differentiation
  5. Question
    Use the Given Contour Plot to Estimate the Linear Approximation
Solved

Use the Given Contour Plot to Estimate the Linear Approximation

Question 59

Question 59

Multiple Choice

Use the given contour plot to estimate the linear approximation of Use the given contour plot to estimate the linear approximation of   at   . Assume each contour line represents a 1 unit increase from left to right with the left-most contour line corresponding to a value of 1.   A)    B)    C)    D)   at Use the given contour plot to estimate the linear approximation of   at   . Assume each contour line represents a 1 unit increase from left to right with the left-most contour line corresponding to a value of 1.   A)    B)    C)    D)   . Assume each contour line represents a 1 unit increase from left to right with the left-most contour line corresponding to a value of 1. Use the given contour plot to estimate the linear approximation of   at   . Assume each contour line represents a 1 unit increase from left to right with the left-most contour line corresponding to a value of 1.   A)    B)    C)    D)
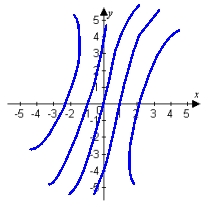

A) Use the given contour plot to estimate the linear approximation of   at   . Assume each contour line represents a 1 unit increase from left to right with the left-most contour line corresponding to a value of 1.   A)    B)    C)    D)
B) Use the given contour plot to estimate the linear approximation of   at   . Assume each contour line represents a 1 unit increase from left to right with the left-most contour line corresponding to a value of 1.   A)    B)    C)    D)
C) Use the given contour plot to estimate the linear approximation of   at   . Assume each contour line represents a 1 unit increase from left to right with the left-most contour line corresponding to a value of 1.   A)    B)    C)    D)
D) Use the given contour plot to estimate the linear approximation of   at   . Assume each contour line represents a 1 unit increase from left to right with the left-most contour line corresponding to a value of 1.   A)    B)    C)    D)

Correct Answer:

verifed

Verified

Unlock this answer now
Get Access to more Verified Answers free of charge

Related Questions

Q54: Find the gradient of the given function.

Q55: Use the chain rule to find the

Q56: Find an equation of the tangent plane

Q57: Find the total differential of <img src="https://d2lvgg3v3hfg70.cloudfront.net/TB5869/.jpg"

Q58: Show that the function <img src="https://d2lvgg3v3hfg70.cloudfront.net/TB5869/.jpg" alt="Show

Q60: Determine all points at which the given

Q61: Describe and sketch the domain of the

Q62: Use Lagrange multipliers to find the maximum

Q63: Find the directions of maximum and minimum

Q64: Compute the directional derivative of f at

Examlex

ExamLex

About UsContact UsPerks CenterHomeschoolingTest Prep

Work With Us

Campus RepresentativeInfluencers

Links

FaqPricingChrome Extension

Download The App

Get App StoreGet Google Play

Policies

Privacy PolicyTerms of ServiceHonor CodeCommunity Guidelines

Scan To Download

qr-code

Copyright © (2025) ExamLex LLC.

Privacy PolicyTerms Of ServiceHonor CodeCommunity Guidelines