Multiple Choice
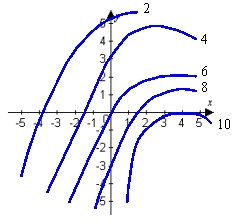
Use the given contour plot to estimate the linear approximation of  at
at  .
. 
A) 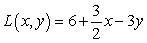
B) 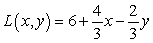
C) 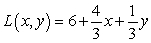
D) 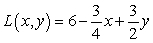
Correct Answer:

Verified
Correct Answer:
Verified
Q36: Compute the indicated function value. <img src="https://d2lvgg3v3hfg70.cloudfront.net/TB5869/.jpg"
Q37: Find the total differential of <img src="https://d2lvgg3v3hfg70.cloudfront.net/TB5869/.jpg"
Q38: Match the surface to its density plot.
Q39: Use Lagrange multipliers to find the maximum
Q40: Find the absolute extrema of <img src="https://d2lvgg3v3hfg70.cloudfront.net/TB5869/.jpg"
Q42: Describe the range of the function. <img
Q43: Find the total differential of <img src="https://d2lvgg3v3hfg70.cloudfront.net/TB5869/.jpg"
Q44: Show that the indicated limit exists. <img
Q45: Which of the following is the contour
Q46: Show that the limit does not exist.