Multiple Choice
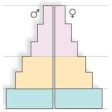
In a population with low death rates, this age structure diagram indicates that 
A) the population is decreasing.
B) the population is stable.
C) the biotic potential must be larger than usual.
D) the population will continue to grow for some time.
Correct Answer:

Verified
Correct Answer:
Verified
Q1: Most species are intermediate between r-strategists and
Q8: The population growth rate is negative when<br>A)birthrate
Q22: From the perspective of population growth,what three
Q42: Dandelions and tent caterpillars,which are r-strategists,are examples
Q43: Identify the distribution patterns of the desert
Q43: A pond represents a(n)_,while the minnows represent
Q46: Intrinsic factors,such as behavior and physiology,may affect
Q47: Farmers sprayed leechi trees to suppress populations
Q48: Early this spring researchers have recently discovered
Q49: The maximum rate of natural increase of