Multiple Choice
Which of these diagrams represents an age structure diagram of more-developed countries? 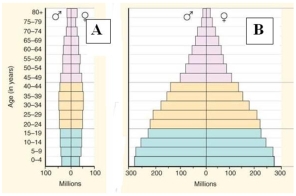
A) Diagram A
B) Diagram B Diagram B is an age structure diagram of less-developed countries, not of more-developed countries.
Correct Answer:

Verified
Correct Answer:
Verified
Related Questions
Q5: The sequence of decreased death rate followed
Q8: Consider the life of the praying mantis.The
Q10: A(n)_ consists of all the populations of
Q13: A population in which death rates are
Q17: When discussing population features,a cohort is described
Q21: The basic level of an ecological study
Q27: Tell what type of growth model is
Q29: What is the expected pattern of growth
Q30: How is environmental impact measured in a
Q31: The carrying capacity of the environment for