Essay
The graph pictured below depicts blood glucose changes after eating a meal. The pink line, drawn with square symbols, represents normal variations in glucose levels after a meal. The black line, drawn with diamond symbols, represents levels seen in diabetes mellitus. Differentiate between the normal and abnormal blood glucose levels after a meal and briefly explain the reason for the abnormality. 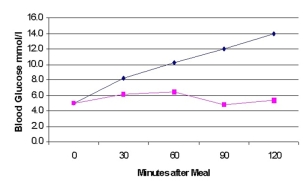
Correct Answer:

Verified
Answers may vary. In the healthy person,...View Answer
Unlock this answer now
Get Access to more Verified Answers free of charge
Correct Answer:
Verified
View Answer
Unlock this answer now
Get Access to more Verified Answers free of charge
Q8: Uncommonly large feet,hands,chin,nose,and eyebrow ridges on a
Q9: Removal of the anterior pituitary would result
Q16: The level of sodium in the blood
Q35: Which of the following is not an
Q36: Explain why a person will develop a
Q39: The removal of the anterior pituitary gland
Q40: Which of the following statements about hormones
Q41: Which of the following is not a
Q42: The target cell concept is illustrated in
Q77: Simple goiter can be prevented by<br>A) surgery