Essay
Draw a graph of an action potential that illustrates voltage changes over time. Define and indicate where depolarization and repolarization occurs. Include and label the region of resting potential, action potential and the threshold. Also describe what occurs in terms of ion movement across the membrane to initiate an action potential and during the action potential. 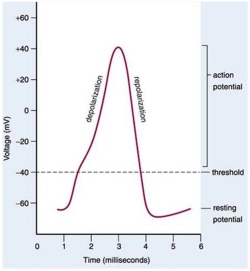
Correct Answer:

Verified
A sample graph of an action potential is...View Answer
Unlock this answer now
Get Access to more Verified Answers free of charge
Correct Answer:
Verified
View Answer
Unlock this answer now
Get Access to more Verified Answers free of charge
Q3: The primary functions of the spinal cord
Q15: Starting with the simplest and moving towards
Q28: The enzyme that breaks down acetylcholine within
Q36: An animal with a ladder-like nervous system
Q39: When you are studying with the TV
Q44: Examine the picture to answer the following
Q47: Ion concentration differences produce an action potential
Q51: An animal with a brain and a
Q53: Information gathering from the environment by a
Q53: Which of the following statements about an