Multiple Choice
The following graph shows the volume of wood produced in a single-species forest. Here  is measured in cubic meters/hectare and t is measured in years. By computing the slopes of the respective tangent lines, estimate the rate at which the wood grown is changing at the beginning of year 10 and at the beginning of year 35.
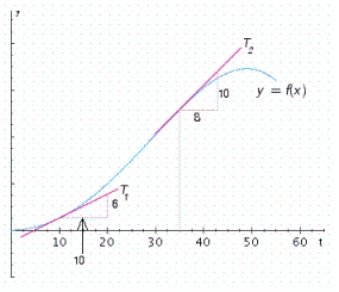
A)  cubic meters/hectare per year in the year 10,


 cubic meters/hectare per year in the year 35
B)  cubic meters/hectare per year in the year 10,


 cubic meters/hectare per year in the year 35
C)  cubic meters/hectare per year in the year 10,


 cubic meters/hectare per year in the year 35
D)  cubic meters/hectare per year in the year 10,


 cubic meters/hectare per year in the year 35
Correct Answer:

Verified
Correct Answer:
Verified
Q146: Find <img src="https://d2lvgg3v3hfg70.cloudfront.net/TB6026/.jpg" alt="Find of
Q147: The gross domestic product (GDP) of a
Q148: During the construction of a high-rise building,
Q149: Find <img src="https://d2lvgg3v3hfg70.cloudfront.net/TB6026/.jpg" alt="Find of
Q150: A function f is continuous at the
Q152: In a certain state, the sales tax
Q153: Find <img src="https://d2lvgg3v3hfg70.cloudfront.net/TB6026/.jpg" alt="Find for
Q154: The total worldwide box-office receipts for a
Q155: Determine whether the given function is a
Q156: Let <img src="https://d2lvgg3v3hfg70.cloudfront.net/TB6026/.jpg" alt="Let .