Essay
Productivity and yield of cultivated crops are often reduced by insect pests. The following graph shows the relationship between the yield of a certain crop,  , as a function of the density of aphids x. (Aphids are small insects that suck plant juices.) Here,
  is measured in kilograms/ 4,000 square meters, and x is measured in hundreds of aphids/bean stem. By computing the slopes of the respective tangent lines, estimate the rate of change of the crop yield with respect to the density of aphids when that density is 200 aphids/bean stem and when it is 800 aphids/bean stem.
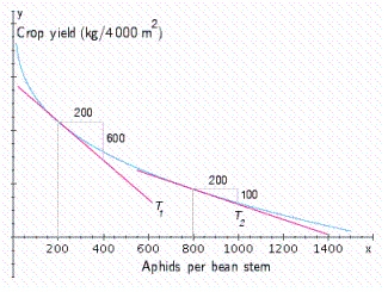
Correct Answer:

Verified
Correct Answer:
Verified
Q129: Refer to the graph of the function
Q130: The 1980s saw a trend toward old-fashioned
Q131: Use the vertical-line test to determine whether
Q132: Find the domain of the function <img
Q133: Let <img src="https://d2lvgg3v3hfg70.cloudfront.net/TB6026/.jpg" alt="Let
Q135: A function f is continuous at the
Q136: Let h be the function defined by
Q137: Find f (a + h) - f
Q138: Entomologists have discovered that a linear relationship
Q139: Use the method of bisection to find