Essay
In the following figure,  gives the population
  of a certain bacteria culture at time t after a portion of bactericide A was introduced into the population at
  . The graph of g gives the population
  of a similar bacteria culture at time t after a portion of bactericide B was introduced into the population at
  .
. 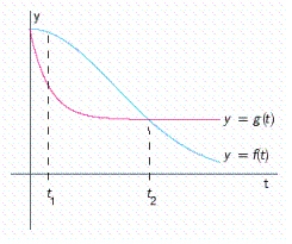 Which population is decreasing faster at
  ?
?
Population __________
Which population is decreasing faster at  ?
?
Population __________
Which bactericide is more effective in reducing the population of bacteria in the short run?
Bactericide __________
Which bactericide is more effective in reducing the population of bacteria in the long run?
Bactericide __________
Correct Answer:

Verified
Correct Answer:
Verified
Q36: Find and simplify <img src="https://d2lvgg3v3hfg70.cloudfront.net/TB6026/.jpg" alt="Find and
Q37: The number of IBM shares that Nancy
Q38: A manufacturer has a monthly fixed cost
Q39: Use the graph of the function f
Q40: Find the limit. <img src="https://d2lvgg3v3hfg70.cloudfront.net/TB6026/.jpg" alt="Find the
Q42: Find <img src="https://d2lvgg3v3hfg70.cloudfront.net/TB6026/.jpg" alt="Find for
Q43: Under a set of controlled laboratory conditions,
Q44: Use the graph of the function f
Q45: Let <img src="https://d2lvgg3v3hfg70.cloudfront.net/TB6026/.jpg" alt="Let ,
Q46: Determine whether the equation defines y as