Multiple Choice
The ratio of working-age population to the elderly in the United States (including projections after 2000) is given by 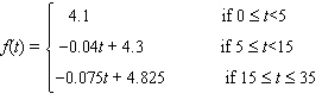 with t = 0 corresponding to the beginning of 1995. What will be the ratio at the beginning of 2005?
A) f(1995) = -75.5
B) f(1995) = 75.5
C) f(10) = -3.9
D) f(10) = 4.7
E) f(10) = 3.9
Correct Answer:

Verified
Correct Answer:
Verified
Q139: Use the method of bisection to find
Q140: Joan is looking straight out a window
Q141: Let f be the function defined by
Q142: In a certain state, the sales tax
Q143: Let <img src="https://d2lvgg3v3hfg70.cloudfront.net/TB6026/.jpg" alt="Let Find
Q145: Use the graph of the function f
Q146: Find <img src="https://d2lvgg3v3hfg70.cloudfront.net/TB6026/.jpg" alt="Find of
Q147: The gross domestic product (GDP) of a
Q148: During the construction of a high-rise building,
Q149: Find <img src="https://d2lvgg3v3hfg70.cloudfront.net/TB6026/.jpg" alt="Find of