Multiple Choice
The following graph shows the ratio of bachelor's degrees earned by women to men from 1960 through 1990. How fast was the ratio changing in the period from 1960 to 1980? From 1980 to 1990? 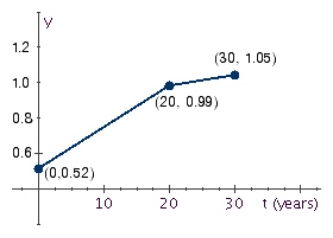
A) 0.0235/yr from 1960 through 1980 0.006/yr from 1980 through 1990
B) 0.47/yr from 1960 through 1980 0.06/yr from 1980 through 1990
C) 0.047/yr from 1960 through 1980 0.006/yr from 1980 through 1990
D) 0.235/yr from 1960 through 1980 0.06/yr from 1980 through 1990
E) 0.047/yr from 1960 through 1980 0.012/yr from 1980 through 1990
Correct Answer:

Verified
Correct Answer:
Verified
Q14: Complete the table by computing <img src="https://d2lvgg3v3hfg70.cloudfront.net/TB6026/.jpg"
Q15: Find f (a + h) - f
Q16: Select the correct graph of the function
Q17: Refer to the graph of the function
Q18: Find the indicated one-sided limit. <img src="https://d2lvgg3v3hfg70.cloudfront.net/TB6026/.jpg"
Q20: Find <img src="https://d2lvgg3v3hfg70.cloudfront.net/TB6026/.jpg" alt="Find given
Q21: Sketch the graph of the function <img
Q22: Let <img src="https://d2lvgg3v3hfg70.cloudfront.net/TB6026/.jpg" alt="Let Find
Q23: The base salary of a salesman working
Q24: Evaluate h (2), where <img src="https://d2lvgg3v3hfg70.cloudfront.net/TB6026/.jpg" alt="Evaluate