Multiple Choice
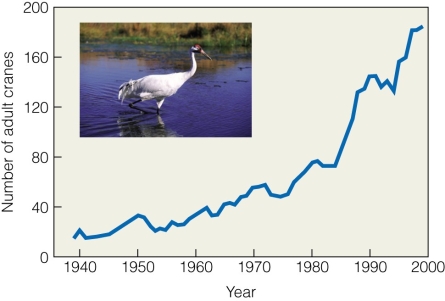 The pattern shown in figure 9.6 best resembles
A) a survivorship curve.
B) exponential growth.
C) R0= 0.
D) r < 0.
Correct Answer:

Verified
Correct Answer:
Verified
Related Questions
Q18: A time-specific life table is constructed by
Q19: A(n)_ distribution refers to the proportion of
Q20: A group of individuals born in the
Q21: Environmental stochasticity refers to random variations in
Q22: Ecologists develop a(n)_ life table to follow
Q24: If N(0)= 30 and λ = 1.20,what
Q25: The gross reproductive rate represents the number
Q26: When the conditions are favorable for a
Q27: Which populations are at greatest risk for
Q28: A population that is growing has a