Multiple Choice
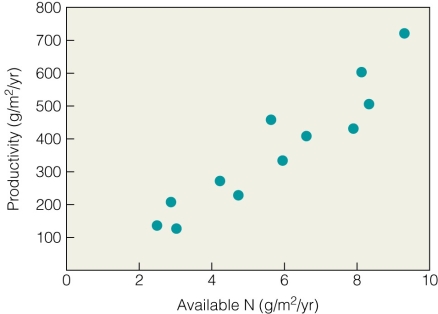 Figure 1.5 represents which type of plot?
A) Random
B) Scatter
C) Linear
D) Factorial
Correct Answer:

Verified
Correct Answer:
Verified
Related Questions
Q33: In a field experiment,an ecologist measures the
Q34: The basic unit in ecology is the<br>A)ecosystem.<br>B)gene.<br>C)individual.<br>D)species.
Q35: Broad scale regions dominated by similar types
Q36: All science begins with _,which is the
Q37: An ecologist measured the length and weight
Q39: Moisture and concentration of oxygen<br>A)are parts of
Q40: A field experiment gives the investigator much
Q41: A scientist wants to manipulate glucose levels
Q42: Which of the following questions is most
Q43: Why is ecology considered an interdisciplinary science?<br>A)It