Essay
Student's Final Grade
A statistics professor investigated some of the factors that affect an individual student's final grade in her course.She proposed the multiple regression model  ,where y is the final grade (out of 100 points),x1 is the number of lectures skipped,x2 is the number of late assignments,and x3 is the midterm exam score (out of 100).The professor recorded the data for 50 randomly selected students.The computer output is shown below. THE REGRESSION EQUATION IS
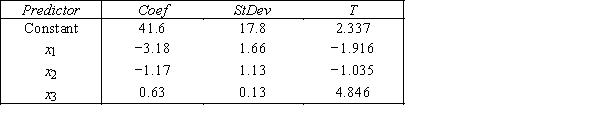 S = 13.74 R−Sq = 30.0% ANALYSIS OF VARIANCE
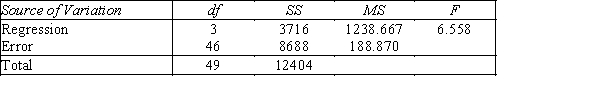
-{Student's Final Grade Narrative} Does this data provide enough evidence at the 1% significance level to conclude that the final grade and the midterm exam score are positively linearly related?
Correct Answer:

Verified
 Rejection region: t > t0.01,46≈ 2.412 Test sta...
View Answer
Unlock this answer now
Get Access to more Verified Answers free of charge
Correct Answer:
Verified
View Answer
Unlock this answer now
Get Access to more Verified Answers free of charge
Q114: If the value of the Durbin-Watson statistic,d,satisfies
Q115: An adverse effect of multicollinearity is that
Q116: The range of the values of the
Q117: When an additional explanatory variable is introduced
Q118: Life Expectancy<br> An actuary wanted to
Q120: When an additional explanatory variable is introduced
Q121: For a multiple regression model the following
Q122: To use the Durbin-Watson test to test
Q123: In a multiple regression analysis,if the model
Q124: A high value of the coefficient of