True/False
-The line chart below shows cucumber prices fluctuated from $2.00 per pound to over $4.50 per pound during the year. 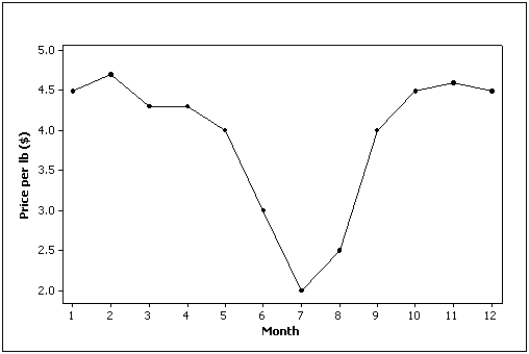
Correct Answer:

Verified
Correct Answer:
Verified
Related Questions
Q2: For which type of data are the
Q15: Which of the following describes a positive
Q44: Provide one example of ordinal data; one
Q51: Which situation identifies when to use pie
Q54: Which of the following represents time-series data?<br>A)The
Q60: A(n)_ histogram has two peaks,not necessarily equal
Q66: From a pie chart you are able
Q70: Interval data may be treated as ordinal
Q86: Which of the following statements describes a
Q87: A(n)_ chart is often used to display