True/False
A professor examines the relationship between minutes studying and exam score (out of 200 points) for a random sample of his students. The scatter diagram is shown below. It appears that study time has somewhat of a positive linear relationship with exam score. 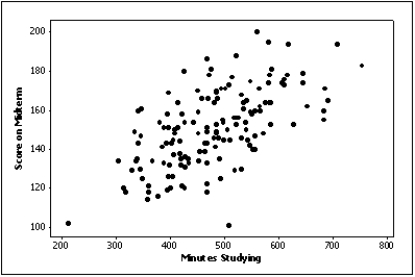
Correct Answer:

Verified
Correct Answer:
Verified
Q2: When a distribution has more values to
Q9: Observations that are measured at the same
Q11: The number of class intervals in a
Q16: Compare the two histograms below. Which statement
Q19: According to the stem-and-leaf plot below, the
Q37: The two most important characteristics to look
Q77: The two most important characteristics to examine
Q83: A modal class in a histogram is
Q114: {Teachers Ages Narrative} Draw a frequency histogram
Q131: Insurance Company A representative from a local