Multiple Choice
Which of the following describes the shape of the histogram below? 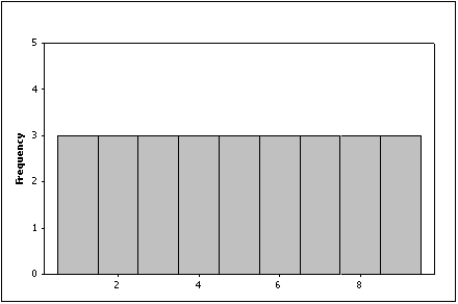
A) Positively skewed
B) Negatively skewed
C) Symmetric
D) None of these choices
Correct Answer:

Verified
Correct Answer:
Verified
Related Questions
Q9: For what type of data are frequencies
Q9: Interval data, such as heights, weights, and
Q10: Car buyers were asked to indicate the
Q11: The number of class intervals in a
Q16: Compare the two histograms below. Which statement
Q20: A bar chart is used to represent
Q37: The two most important characteristics to look
Q77: The two most important characteristics to examine
Q83: A(n)_ chart is not able to show
Q131: Insurance Company A representative from a local