Multiple Choice
What type of graph depicts the data below? 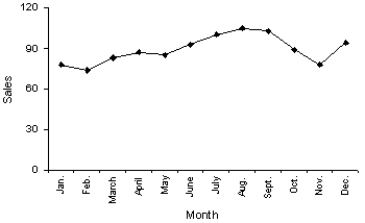
A) A line chart
B) A histogram
C) A dot plot
D) A bar chart
Correct Answer:

Verified
Correct Answer:
Verified
Related Questions
Q23: Give an example of interval data that
Q25: Bar and pie charts are graphical techniques
Q63: Which of the following statements about shapes
Q67: All calculations are permitted on what type
Q93: All calculations are permitted on interval data.
Q111: Time-series data are often graphically depicted how?<br>A)Bar
Q113: Consider the following cumulative frequency distribution.<br> <img
Q115: Beef prices throughout the year (month 1
Q118: Suppose you measure the number of minutes
Q149: Insurance Company A representative from a local