Multiple Choice
Which of the following statements describe(s) the line chart below? 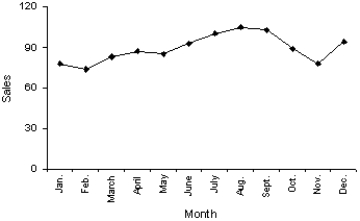
A) November experienced the lowest sales throughout the year.
B) August experienced the highest sales throughout the year.
C) Sales did not fluctuate more than 30 units on either side of 90.
D) All of these choices are true.
Correct Answer:

Verified
Correct Answer:
Verified
Related Questions
Q9: Interval data, such as heights, weights, and
Q9: For what type of data are frequencies
Q10: Car buyers were asked to indicate the
Q17: A skewed histogram is one with a
Q20: A bar chart is used to represent
Q21: Observations that are measured at the same
Q40: Your age is an interval variable.
Q83: A(n)_ chart is not able to show
Q89: In purchasing an automobile,there are a number
Q92: Electronics Company At a meeting of