Short Answer
The line chart below shows potato prices per pound for each month from January (month 1) to December last year. By looking at this chart you can see the lowest potato prices occurred in ____________________. 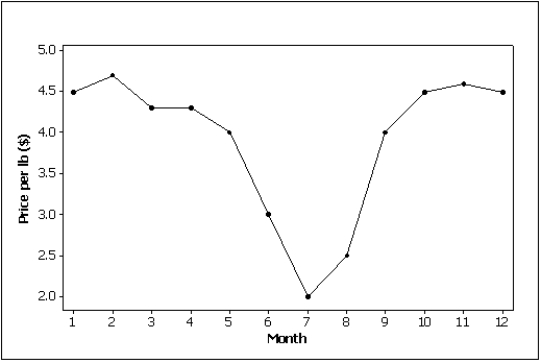
Correct Answer:

Verified
Correct Answer:
Verified
Related Questions
Q15: The final grade received in a Literature
Q16: One of the advantages of a pie
Q20: Insurance Company A representative from a local
Q21: With nominal data,there is one and only
Q35: Explain the difference between a histogram and
Q68: In purchasing a used computer,there are a
Q113: A histogram is said to be _
Q137: One of the variables used to help
Q147: Internet Classes<br>A survey of 25 students
Q153: Compare the spread of the two histograms