Essay
Business School Graduates: A sample of business school graduates were asked what their major was. The results are shown in the following frequency distribution.

-If you were only given the frequency bar chart below, would you able to reconstruct the original observations in the data set? 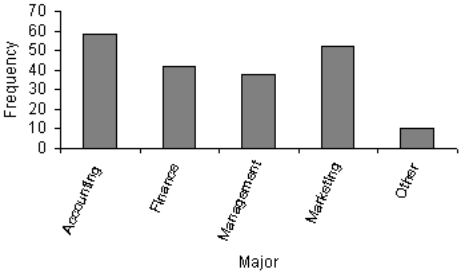
Correct Answer:

Verified
No; you cannot reconstruct the original ...View Answer
Unlock this answer now
Get Access to more Verified Answers free of charge
Correct Answer:
Verified
View Answer
Unlock this answer now
Get Access to more Verified Answers free of charge
Q8: In a pie chart,each slice is proportional
Q37: Whether or not you are over the
Q45: Time series data are often graphically depicted
Q48: What kind(s)of data can be depicted by
Q55: {Test Grades Narrative} Construct frequency and relative
Q89: Teachers Ages<br>The ages (in years)of a
Q105: Experience shows that few students hand in
Q107: Time series data are often graphically depicted
Q151: In a histogram a(n)_ class is the
Q155: We create a frequency distribution for interval