Essay
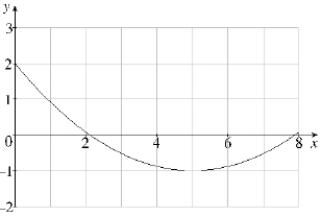
The graph of a function f is given below. Estimate using 4 subintervals with sample points:  (a) right endpoints.(b) left endpoints.(c) midpoints.
Correct Answer:

Verified
Correct Answer:
Verified
Related Questions
Q58: The velocity of a particle moving
Q59: Evaluate the integral <span class="ql-formula"
Q60: Determine whether each integral is convergent
Q61: Evaluate <span class="ql-formula" data-value="\int _
Q62: Evaluate the following integrals:<br>(a) <span
Q64: The following table shows the speedometer
Q65: Evaluate <span class="ql-formula" data-value="\int \frac
Q66: Determine whether each integral is convergent
Q67: Use the Midpoint Rule with n
Q68: Find the value of the integral