Antigen Receptor Signaling and Lymphocyte Activation , SLP-76, ITK, ZAP-70, LCK, LAT, and the CD3 and by Cross-Linking
Essay
Antigen receptor signaling and lymphocyte activation.antibody coupled to biotin, followed by cross-linking with Streptavidin (S-Av). As the antibody and then S-Av are added, the cells are run on the flow cytometer to examine the fluorescence of the Ca2+-sensitive dye. After several minutes of analysis, the cells are stimulated with ionomycin (Iono), to induce Ca2+ influx; this is used as a positive control to ensure that the cells are loaded with the dye. In Figure Q41)A, the characteristic pattern of Ca2+ influx is shown in the red line (wild-type; WT), where TCR stimulation causes a sharp rise in cytoplasmic Ca2+, followed by a slow decline over hours. As shown below, cytoplasmic Ca2+ concentrations do not normally return to baseline for the timecourse of this experiment. A mutant mouse is identified with a defect in T cell activation in response to TCR stimulation. The calcium response of T cells from the mutant mouse is shown in the blue line. 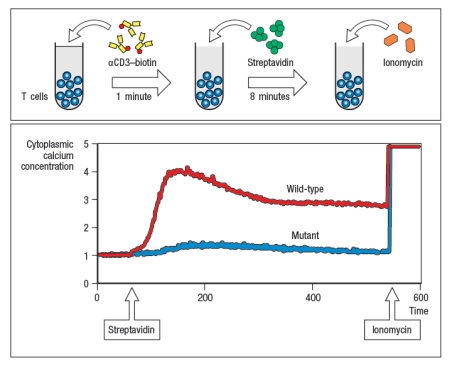
a) Given these data, name three T cell signaling proteins that could be defective in the mutant T cells. Then name three T cell signaling proteins that could not be responsible for this defect, even if mutated.
Additional experiments are performed to analyze protein tyrosine phosphorylation in response to TCR stimulation. For these experiments, T cells are stimulated with anti-CD3 antibody, and then lysates are prepared and run on a protein (SDS-PAGE) gel to separate the proteins by molecular weight. The proteins are transferred from the gel to a membrane for immunoblotting using an antibody that binds to all phosphorylated tyrosine residues in any protein; this antibody is called ‘anti-phospho-tyrosine antibody,’ and is abbreviated as anti-P-Y. The results are shown in Figure .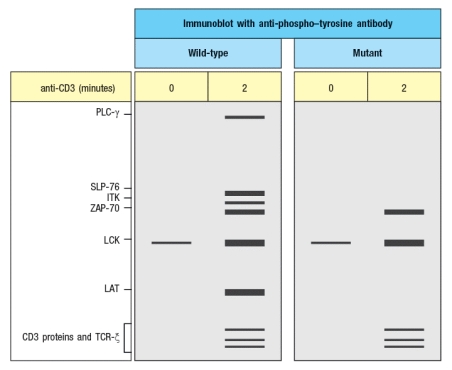
You confirm that the mutant T cells express normal levels of all the proteins detected in the WT cells, including PLC- , SLP-76, ITK, ZAP-70, LCK, LAT, and the CD3 and TCR proteins.
b) Based on these additional data, which of the candidate proteins in your answer to part (a) are ruled out? Briefly explain your answer.
c) What protein is most likely defective in the mutant cells and why?
d) For the protein you named in your answer to part (c), which amino acids or domain of the protein could be mutated to account for all the data.
Correct Answer:

Verified
Correct Answer:
Verified
Q1: Several small GTPases play critical roles in
Q2: Antigen receptor signaling pathways are regulated by
Q4: Unlike TCR signaling, B cell receptor (BCR)
Q5: Second messengers, such as calcium ions (Ca<sup>2</sup><sup>+</sup>),
Q6: Immunoreceptor signaling proteins, such as the
Q7: The TCR signaling module leading to
Q8: TCR stimulation was shown to affect ICAM-1
Q9: The TCR and BCR are multi-subunit receptor
Q10: The immunosuppressive drug rapamycin acts by inhibiting
Q11: All of the modular protein domains used