Multiple Choice
Which of these can be concluded from the figure below? 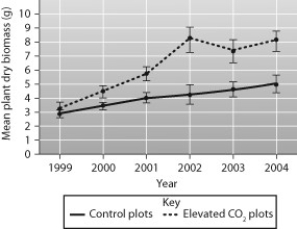
A) In some years of the study the mean poison ivy biomass decreased to the level it was at the beginning of the study.
B) There were more elevated CO2 plots than control plots.
C) Not all of the increase in mean poison ivy biomass can be attributed to the CO2 that the researcher added.
D) Poison ivy in the experimental plots was more toxic than that in the control plots.
Correct Answer:

Verified
Correct Answer:
Verified
Q13: Global warming due to the greenhouse effect
Q14: What is the likely origin of chloroplasts?<br>A)
Q15: CO<sub>2 </sub>enters and O<sub>2</sub> escapes from a
Q16: Which of the following best describes the
Q17: The ultimate source of all the food
Q19: A packet of light energy is called
Q20: Which of the following is not an
Q21: In most green plants, chloroplasts are<br>A) concentrated
Q22: Which of the following statements about the
Q23: The electrons lost from the reaction center