Multiple Choice
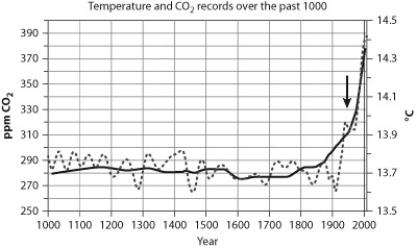 The graph shows records of temperature (light gray line) and CO2 (dark gray line) over the past 1,000 years. CO2 is recorded in parts per million (ppm) .
-Currently, atmospheric CO2 levels are approximately 400 ppm. The annual mean growth rate in CO2 is about 2 ppm/year. Assuming this trend continues, what would you predict the CO2 level to be in 100 years?
A) 100 ppm
B) 200 ppm
C) 600 ppm
D) 1,000 ppm
Correct Answer:

Verified
Correct Answer:
Verified
Q58: The oxygen released into the air as
Q59: Carbon fixation<br>A) occurs when carbon atoms from
Q60: What is the name given to organisms
Q61: Clusters of light-gathering pigments in a photosystem<br>A)
Q62: It has been suggested that scientists should
Q64: Which of the following colors contributes the
Q65: Chlorophyll is located in _, which are
Q66: The light reactions occur in the _,
Q67: Atrazine is a widely used herbicide that
Q68: To produce one glucose, the Calvin cycle