Multiple Choice
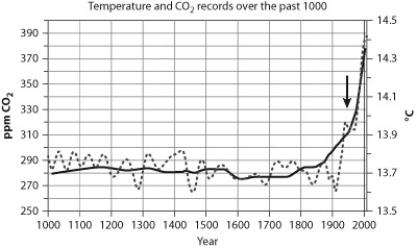 The graph shows records of temperature (light gray line) and CO2 (dark gray line) over the past 1,000 years. CO2 is recorded in parts per million (ppm) .
-If the trends shown in the graph continue, how might this affect photosynthesis?
A) Photorespiration may increase, leading to an increase in photosynthetic production of sugar.
B) Photorespiration may increase, leading to a decrease in photosynthetic production of sugar.
C) C4 and CAM plants would be unable to photosynthesize.
D) There would be no effect on photorespiration, since CO2 and temperature are stable.
Correct Answer:

Verified
Correct Answer:
Verified
Q21: In most green plants, chloroplasts are<br>A) concentrated
Q22: Which of the following statements about the
Q23: The electrons lost from the reaction center
Q24: You're conducting an experiment to determine the
Q25: Which of the following statements about the
Q27: Plants use sugars as a<br>A) fuel for
Q28: As a result of the cascade of
Q29: Photophosphorylation during photosynthesis differs from oxidative phosphorylation
Q30: Photosystem II<br>A) receives electrons from photosystem I.<br>B)
Q31: _ cells in leaves are specialized for