Multiple Choice
The accompanying figure shows data from an experiment in which researchers measured how far dynein (a motor protein) traveled in the presence and absence of dynactin (another type of protein) . The y-axis shows the percent of the time that the researchers observed either dynein or dynein + dynactin "walking" a certain distance on a microtubule. What can you conclude from these data? 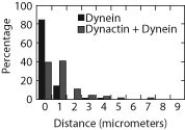
A) The addition of dynactin caused dynein to travel farther along the microtubule.
B) Dynein traveled farther in the absence of dynactin.
C) A higher fraction of the dynein proteins were motile in the absence of dynactin.
D) Dynactin would have the same effects on dynein movement on microfilaments.
Correct Answer:

Verified
Correct Answer:
Verified
Q21: The main function of the rough endoplasmic
Q22: A scientist wants to magnify a pollen
Q23: The endomembrane system includes all of the
Q24: During cell reproduction, chromatin fibers coil up
Q25: Which of the following cells has the
Q27: Studies of the endomembrane system often involve
Q28: According to the accompanying figure, which of
Q29: The cells that produce hair made of
Q30: Which of the following statements about cells
Q31: Mitochondria differ from chloroplasts in that mitochondria<br>A)