Multiple Choice
According to this graph of changes in Earth's atmosphere, which change took place between the years 1800 and 2000? 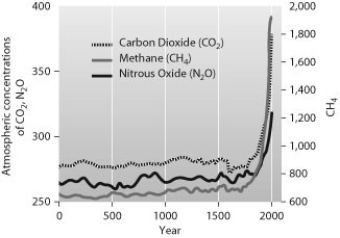
A) Nitrous oxide (N2O) levels increased from 270 ppb to 390 ppb.
B) Carbon dioxide (CO2) levels increased from 950 ppb to 1,800 ppb.
C) Carbon dioxide (CO2) levels increased from 290 ppm to 380 ppm.
D) Methane (CH4) levels increased from 270 ppm to almost 2,000 ppm.
Correct Answer:

Verified
Correct Answer:
Verified
Q7: One result of Costa Rica's commitment to
Q8: In Clackamas, Oregon, a stand of hybrid
Q9: If wolves were now removed from Yellowstone
Q10: Some populations, especially those with high genetic
Q11: To decrease air pollution created from sulfur
Q13: The current rate of extinction may be
Q14: Rice is a staple crop across Asia;
Q15: The International Union for the Conservation
Q16: You are a climate scientist who wants
Q17: As the climate warms, the population ranges