Multiple Choice
According to this graph of population growth in Mexico, in what year was the rate of population increase in Mexico the greatest? 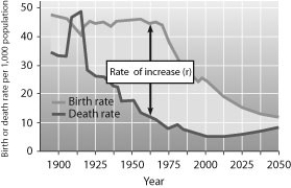
A) 1912
B) 1930
C) 1965
D) 2000
Correct Answer:

Verified
Correct Answer:
Verified
Related Questions
Q1: If most of the individuals of a
Q2: The pattern of distribution for a certain
Q4: Which statement regarding logistic growth is true?<br>A)
Q5: Which statement about human population growth is
Q6: A demographic tool used to predict a
Q7: Which organisms best illustrates K-selection?<br>A) the production
Q8: An African family that has been displaced
Q9: Which is an example of a population?<br>A)
Q10: A group of individuals of a single
Q11: An r-selected species typically<br>A) offers considerable parental