Multiple Choice
In this graph of estrogen and progesterone in the female reproductive cycle, the center dotted line represents day 14. Which of these is true? 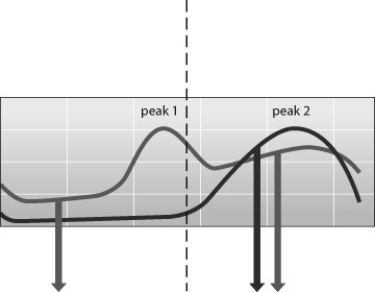
A) The peak 1 shows the surge that causes breakdown of the uterine lining.
B) The peak 2 is brought about in response to high levels of FSH.
C) The peak 2 causes complete buildup of the uterine lining (endometrium) .
D) The two hormonal peaks ensure that fertilization will not occur.
Correct Answer:

Verified
Correct Answer:
Verified
Q37: Which of the following statements regarding infertility
Q38: Fertilization in the female reproductive tract typically
Q39: Which process does not aid expulsion of
Q40: <img src="https://d2lvgg3v3hfg70.cloudfront.net/TB6039/.jpg" alt=" -Which
Q41: Cells migrate from one place to another
Q43: Reproductive systems with external fertilization are most
Q44: Which statement regarding spermatogenesis and oogenesis is
Q45: When does the human blastocyst implant in
Q46: When a chemical signal from a group
Q47: Two important contributions that cleavage makes to