Multiple Choice
Physicians routinely give their patients pulmonary function tests in order to measure characteristics of lung function. The most common of these tests, spirometry, measures both the volume and the speed of air entering and exiting the lungs. In this test, a person first breathes normally while breathing into a spirometer, a machine that measures air volume and air speed. Then the person takes the deepest breath possible and exhales as hard as possible for 6 seconds into the spirometer. The resulting data are plotted on a graph of volume (y axis) versus time (x axis) . Spirometry is useful not only for assessing lung function in healthy patients but also for characterizing patients with lung conditions such as pulmonary fibrosis, asthma, or emphysema.
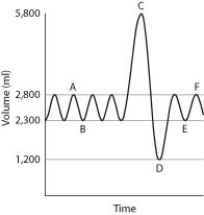
A sample graph for a healthy adult male is shown below. Normal breathing occurs between points A and B, a maximal inhalation occurs at point C, and a maximal exhalation occurs at point D. Normal breathing resumes between points E and F.
-Patients with emphysema have lungs that are less elastic than normal. As a result, they cannot exhale as much air as a healthy person can, thereby leaving additional residual volume in the lungs. How would the preceding graph differ if an emphysema patient's data were plotted instead of a healthy person's?
A) The difference in volume between points A and B would be larger.
B) The difference in volume between points C and D would be larger.
C) Point A would be at a smaller volume.
D) Point D would be at a larger volume.
Correct Answer:

Verified
Correct Answer:
Verified
Q11: One advantage of gas exchange in water
Q12: The tracheal system of an insect is
Q13: Cigarette smoke can affect the white blood
Q14: <img src="https://d2lvgg3v3hfg70.cloudfront.net/TB6039/.jpg" alt=" -At
Q15: Most CO<sub>2</sub> is transported to the lungs
Q17: The oxygen-carrying component in red blood cells
Q18: Which animal requires the largest and most
Q19: When you are breathing normally, exhalation results
Q20: The evolution of aquatic vertebrates that could
Q21: Which of the figures shown represents countercurrent