Multiple Choice
Below is a figure from an experiment that was performed to measure the effect of carbonate ion (CO32-) concentration on the calcification (growth) rate of coral reefs. At which point on the graph is the ocean pH the lowest? 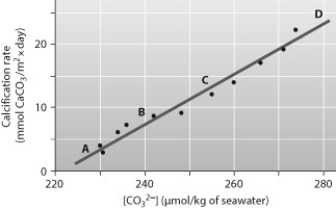
A) A
B) B
C) C
D) D
Correct Answer:

Verified
Correct Answer:
Verified
Q35: You want to design an experiment to
Q36: A hydrogen atom has one electron. How
Q37: The four most common elements in living
Q38: <img src="https://d2lvgg3v3hfg70.cloudfront.net/TB6039/.jpg" alt=" Thin-layer
Q39: In ocean acidification, dissolving CO<sub>2</sub> gas _
Q41: Household ammonia has a pH of 12;
Q42: How will a lower ocean pH caused
Q43: Which of the following statements best describes
Q44: What is the fundamental difference between covalent
Q45: In some areas, fluoride is added during