Multiple Choice
The graph below is of an index of diversity of arthropods in three different plots of a cornfield. In one of the three plots an insecticide was sprayed. Answer the questions below about this situation.
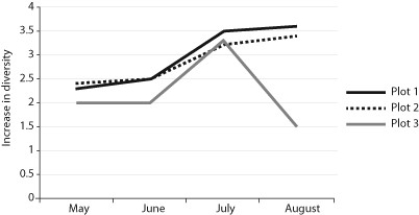 Arthropod diversity in three cornfield plots.
-Which of the following conclusions is supported by the data shown in the graph?
A) Some species were disappearing as others were appearing.
B) There were more individual arthropods in each of the plots in July than in any other month.
C) In general, species diversity for all three plots taken together was greatest in July.
D) In August, Plot 2 had the greatest species diversity.
Correct Answer:

Verified
Correct Answer:
Verified
Q40: According to the "new" revised phylogeny based
Q41: Which of the following statements about deuterostomes
Q42: The symmetry of echinoderms generally includes<br>A) radially
Q43: Tapeworms are similar to fungi in that
Q44: Which of the following phyla is most
Q46: A bilaterally symmetrical, wormlike animal that has
Q47: Which of the following are not included
Q48: Which of the following exhibits bilateral symmetry?<br>A)
Q49: An organism that can fly and has
Q50: _ are soil dwellers; _ are mostly