Multiple Choice
The data in this graph indicate 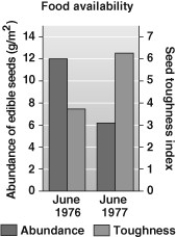
A) there were fewer total tough seeds in 1976 than in 1977.
B) plants that produced soft seeds in 1976 produced tougher seeds in 1977.
C) available seeds were generally tougher in 1977 than in 1976.
D) seed abundance in 1977 was severely reduced by finch feeding.
Correct Answer:

Verified
Correct Answer:
Verified
Q12: Which of the following types of reproductive
Q13: Which of the following types of reproductive
Q14: Which of the following descriptions best represents
Q15: Which of the following would tend to
Q16: If H. floresiensis were reunited with H.
Q18: Which of the following would a biologist
Q19: One of the finest available sequences of
Q20: A new plant species may arise in
Q21: The Grants' work on natural selection would
Q22: Which of the following statements about the