Multiple Choice
Which of the following graphs illustrates the growth over several seasons of a population of snowshoe hares that were introduced to an appropriate habitat also inhabited by predators in northern Canada?
A) 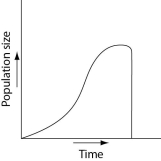
B) 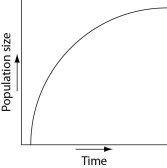
C) 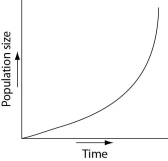
D) 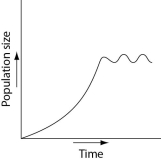
E) 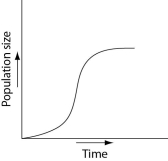
Correct Answer:

Verified
Correct Answer:
Verified
Related Questions
Q7: Which of the following events might you
Q33: Which of the following sets of measurements
Q39: Which of the following examples of an
Q44: What would be the effect on climate
Q51: Trees are not usually found in the
Q52: Fire suppression by humans<br>A) will always result
Q58: Long-term studies of Belding's ground squirrels show
Q58: Which of the following statements best describes
Q59: As N approaches K for a certain
Q72: The eight climographs below show yearly temperature