Multiple Choice
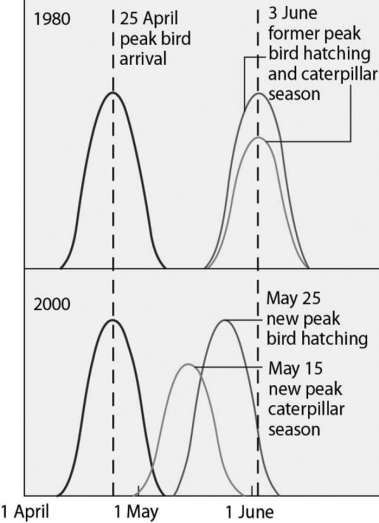 Figure 43.3
Use the graph in Figure 43.3 and the information provided in the paragraph below to answer the following questions.
Flycatcher birds that migrate from Africa to Europe feed their nestlings a diet that is almost exclusively moth caterpillars. The graph in Figure 43.3 shows the mean (peak) dates of bird arrival, bird hatching, and caterpillar season for the years 1980 and 2000.
-Suppose you attend a town meeting at which some experts tell the audience that they have performed a cost-benefit analysis of a proposed transit system that would probably reduce overall air pollution and fossil fuel consumption. The analysis, however, reveals that ticket prices will not cover the cost of operating the system when fuel, wages, and equipment are taken into account. As a biologist, you know that if ecosystem services had been included in the analysis the experts might have arrived at a different answer. Why are ecosystem services rarely included in economic analyses?
A) People take them for granted because we generally do not pay for them.
B) They are not worth much and would not greatly change the cost-benefit analysis.
C) There are too many variables to include in ecosystem services, making their calculation impossible.
D) Ecosystem services only take into account abiotic factors that affect local environments.
Correct Answer:

Verified
Correct Answer:
Verified
Q12: If the sex ratio in a population
Q13: Which of the following provides the best
Q28: Please use the following information to answer
Q30: How should the scientist draw a graph
Q50: The difference between an endangered species and
Q62: Which of the following conditions is the
Q63: Which of the following is true about
Q67: <img src="https://d2lvgg3v3hfg70.cloudfront.net/TB6148/.jpg" alt=" Figure 43.1 Figure
Q69: Please use the following information to answer
Q71: The concept of sustainable development emphasizes<br>A) the