Multiple Choice
Which of the following graphs illustrates the population growth curve of single bacterium growing in a flask of ideal medium at optimum temperature over a 24-hour period?
A) 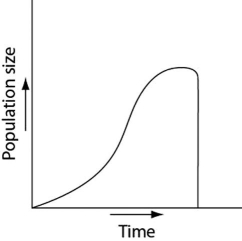
B) 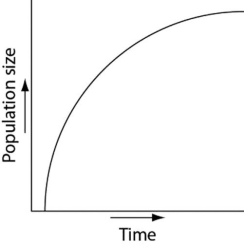
C) 
D) 
E) 
Correct Answer:

Verified
Correct Answer:
Verified
Related Questions
Q53: Generalized global air circulation and precipitation patterns
Q71: A population's carrying capacity<br>A)may change as environmental
Q83: Long-term studies of Belding's ground squirrels show
Q84: Often the growth cycle of one population
Q85: Which of the following is the best
Q86: In which of the following situations would
Q87: Which of the following methods would provide
Q89: What is an assumption of the logistic
Q90: Which of the following events might you
Q92: What is population dispersion?<br>A) the number of