Multiple Choice
Which of the following graphs illustrates the growth curve of a small population of rodents that has grown to reach a static carrying capacity?
A) 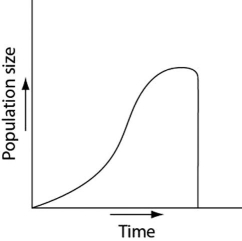
B) 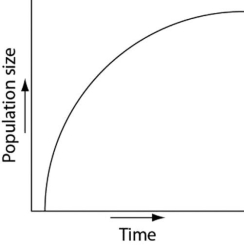
C) 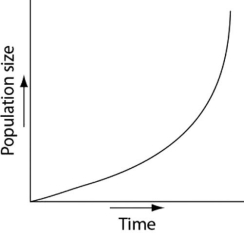
D) 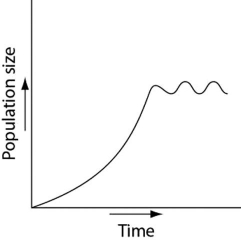
E) 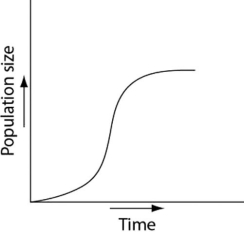
Correct Answer:

Verified
Correct Answer:
Verified
Related Questions
Q40: Why do populations grow more slowly as
Q41: Use the survivorship curves in Figure 53.1
Q56: Which of the following levels of ecological
Q69: Which variables define the ecological life history
Q76: Fire suppression by humans<br>A) will always result
Q80: Which of the following groups would be
Q83: Long-term studies of Belding's ground squirrels show
Q84: Often the growth cycle of one population
Q85: Which of the following is the best
Q86: In which of the following situations would