Multiple Choice
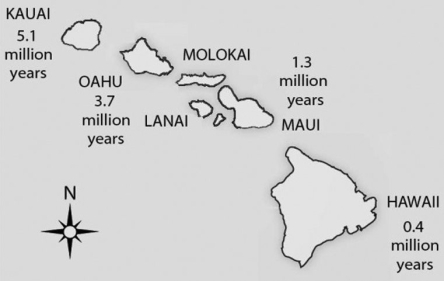 Figure 23.3
-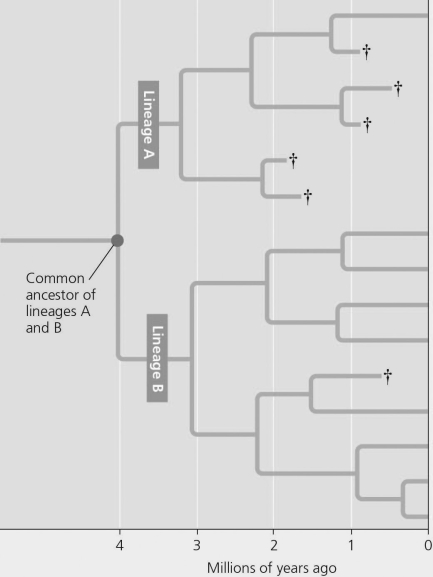 Figure 23.4
This evolutionary tree shows the influence of speciation and extinction on the diversity of life. After 2 million years lineage A had a(n) ________ rate of speciation and ________ extinction rates compared to lineage B.
A) higher; lower
B) lower; higher
C) increased; decreased
D) improved; enhanced
Correct Answer:

Verified
Correct Answer:
Verified
Q2: The major evolutionary episode corresponding most closely
Q18: All animals with eyes or eyespots that
Q21: The appearance of Pax-6 in all animals
Q21: Pax-6 usually causes the production of a
Q28: <img src="https://d2lvgg3v3hfg70.cloudfront.net/TB7910/.jpg" alt=" Figure 23.1 -Assuming
Q39: If the half-life of carbon-14 is about
Q42: Many species of snakes lay eggs.However,in the
Q47: Upon being formed, oceanic islands, such as
Q58: Which event stimulated the rapid development of
Q60: The following questions refer to this hypothetical