Multiple Choice
The next question(s) refer to Table 20.1, which compares the % sequence homology of four different parts (two introns and two exons) of a gene that is found in five different eukaryotic species. Each part is numbered to indicate its distance from the promoter (for example, intron I is the one closest to the promoter) . The data reported for species A were obtained by comparing DNA from one member of species A to the DNA of another member of species A. 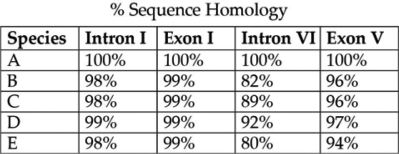 Table 20.1
-Based on the tabular data, and assuming that time advances vertically, which cladogram (a type of phylogenetic tree) is the most likely depiction of the evolutionary relationships among these five species?
A) 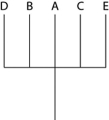
B) 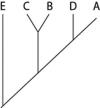
C) 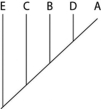
D) 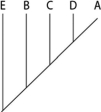
Correct Answer:

Verified
Correct Answer:
Verified
Q1: The common ancestors of birds and mammals
Q3: A potential source of confusion in constructing
Q15: Please use the following information to answer
Q28: Cladograms (a type of phylogenetic tree)constructed from
Q50: In addition to naming species, Linnaeus also
Q51: A) that these organisms are phenotypically more
Q54: A polytomy on a phylogenetic tree represents<br>A)
Q55: The relative lengths of the frog and
Q57: The importance of computers and of computer
Q59: Please use the following information to answer